Pandas Tutorial 2026
2.Understanding Pandas DataFrames: What They Are and How to Use Them
3.How to Remove Empty Cells or Missing Data in Pandas
4.Plotting with Pandas
5.How to Select Specific Columns and Rows in Pandas (loc, iloc)
6.How to modify DataFrames
7.How to Use Aggregate Functions in Pandas
8.How to merge tables in Pandas
Pandas
Pandas is a popular Python library for analyzing data. If you are interested in a specific topic, you can just jump into that topic. If you want to learn the Pandas library from scratch, start reading from the beginning. You can use the Pandas library with other Python libraries. If you want to learn about the Seaborn library, please visit the Seaborn tutorial. If you want to learn about the Scikit-learn library, please visit the Scikit-learn tutorial. If you want to learn about the NumPy library, please visit the NumPy tutorial. If you want to learn about the Matplotlib library, please visit the Matplotlib tutorial. You can use your editor to test your code. Visual Studio Code and Pandas 2.2.2 will be used for the tutorial below.
How to install Pandas in Python
You need to set up a virtual environment in Python. You need to install virtualenv. If you are using pip, run the command below:
pip install virtualenv
If you are using pip3, use pip3 instead of pip.
You need to create a virtual environment in your Python project folder. If you are using pip, run the command below:
python -m venv new_env
If you are using python3, use python3 instead of python. We named the virtual environment "new_env" but you can choose another name.
You can activate the environment:
source new_env/bin/activate
If you are using pip, run the command below:
pip install pandas
If you are using conda, run the command below:
conda install -c conda-forge pandas
To check the version of Pandas library:
import pandas as pd
print(pd.__version__)
If you don't want to deal with setting up Pandas, you can try using Jupyter Notebook, which is easy and convenient. However, an older version of Pandas may be installed, and some newer methods might not work. Therefore, you may need to upgrade it.
Alternatively, if you want to run the code without any installation, you can use Google Colab.
Understanding Pandas DataFrames: What They Are and How to Use Them
After importing the Pandas library, you can create a DataFrame. DataFrame in Python refers to the tabular data (that is organized into a table).
How to Perform CRUD Operations on Pandas DataFrames in Python
You can create, read, edit, delete, and analyze DataFrames with Pandas.
import pandas as pd
Let's create a pandas DataFrame:
df1 = pd.DataFrame({
'Product ID': [1, 2, 3, 4],
'Product Name': ['t-shirt', 't-shirt', 'skirt', 'skirt'],
'Color': ['blue', 'green', 'red', 'black'],
'Price': [10, 15, 17, 20]
})
You can write both rows and columns, like in the example above. There are other ways to create a DataFrame. For example, you can add columns (column names) after the rows:
df2 = pd.DataFrame([
[1, 't-shirt', 'blue', 10],
[2, 'skirt', 'blue', 15],
[3, 'jeans', 'blue', 12],
[4, 'dress', 'blue', 20]],
columns = ['Product ID', 'Product Name', 'Color', 'Price']
)
Loading data
You can also use csv files:
df = pd.read_csv('data.csv')
Inspecting DataFrames
You can read the first 5 rows:
df.head()
You can use the tail() method to read the last 5 rows:
df.tail()
You can use the info() function to get information about the data:
df.info()
How to Remove Empty Cells or Missing Data in Pandas
The DataFrame below shows a restaurant's orders. It displays the id, the food, and the price (in USD) of the orders:
import pandas as pd
food_order = pd.DataFrame([
[1, "pizza", 10],
[2, "pasta", 8],
[3, "lunch box", 12],
[4, "pizza", 8,],
[5, "pasta", 6],
[6, "lunch box", 9],
[7, "dessert", 7]
], columns= ["id", "Food", "Price"])
Let's add another column called "Delivery Method" to our DataFrame:
import numpy as np
food_order["Delivery Method"] = ["Delivery", np.nan, "Click & Collect", np.nan, "Delivery", np.nan, np.nan]
print(food_order)
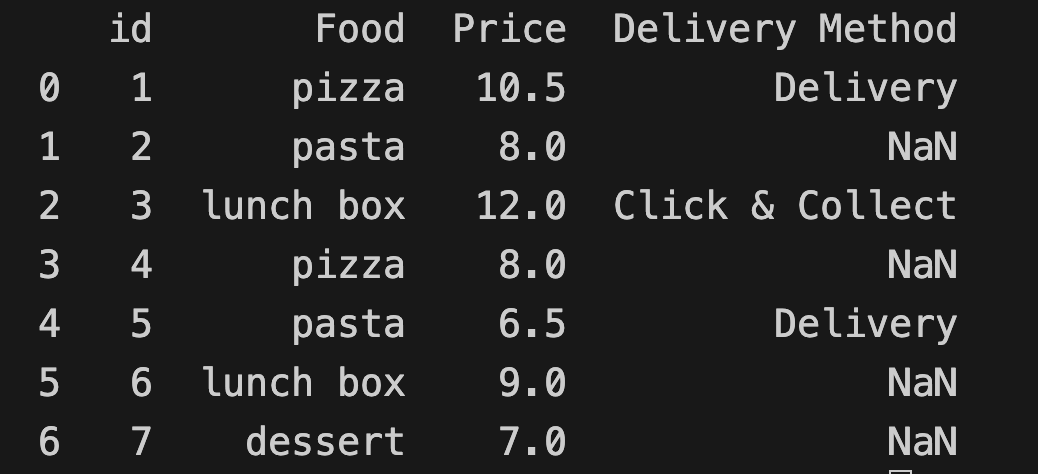
The Numpy library is used to create NaN values.
You can either remove rows with empty cells or replace them with a value.
You can remove empty cells:
food_order = food_order.dropna()
print(food_order)
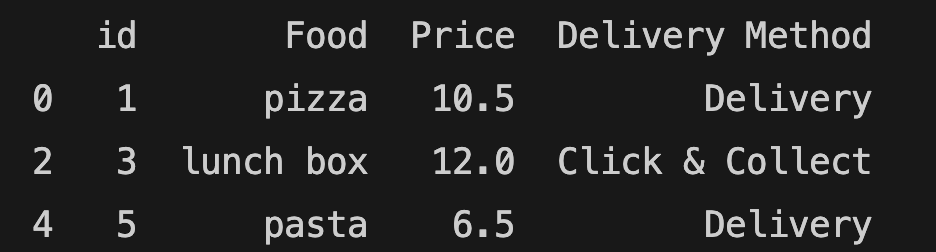
The method above removes all the rows with empty values. dropna() is a new method and if you are using an old version of Pandas, dropna() method won't work. You need to install 2.0.0 or a newer version of Pandas.
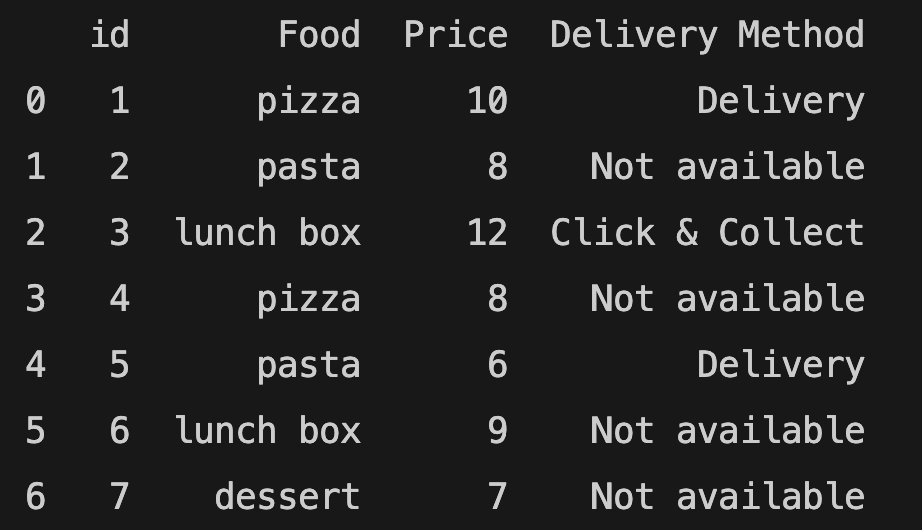
Fill empty cells with a value
If you want to remove empty cells and change the original data, you need to add "inplace=True" argument. You can also replace empty cells with a value.
food_order.fillna("Not available", inplace=True)
print(food_order)
Removing duplicates
If there are duplicate rows in your DataFrame, you can remove duplicates using drop_duplicates:
food_order.drop_duplicates(inplace=True)
Plotting with Pandas
import pandas as pd
food_order = pd.DataFrame([
[1, "pizza", 12, 10],
[2, "pasta", 13, 8],
[3, "lunch box", 12, 12],
[4, "salad", 14, 8,],
[5, "soup", 13, 6],
[6, "burger", 15, 9],
[7, "dessert", 16, 7]
], columns= ["id", "Food", "Time", "Price"])
Pandas library uses the plot() method to create diagrams. You can specify the plot type:
food_order.plot(kind="scatter")
You need to import the Matplotlib library to display the plot.
import matplotlib.pyplot as plt
You can also specify labels for the x and y axes:
food_order.plot(kind="scatter", x="Price", y="Time")
plt.show()
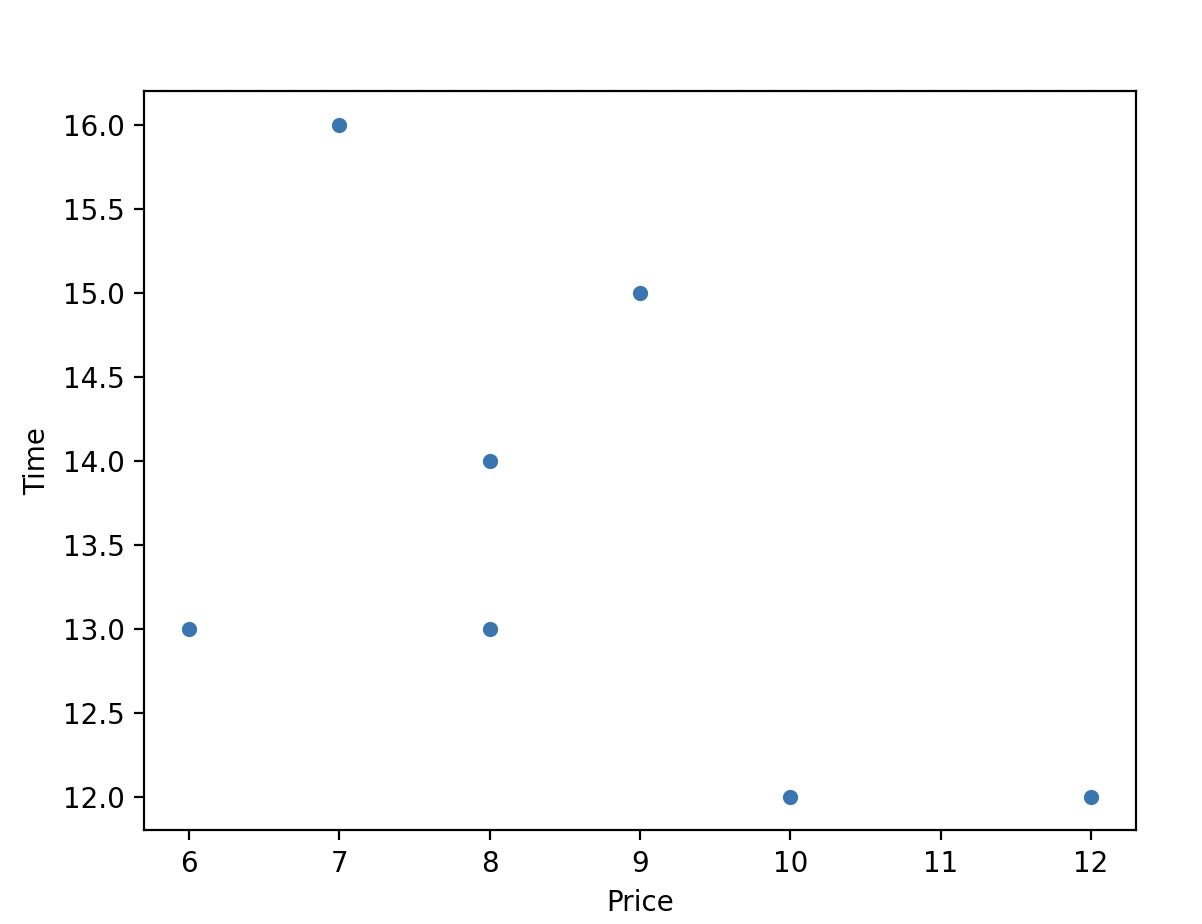
You can see the relationship between price and time variables.
Histogram
You can create a histogram for only one column:
food_order["Price"].plot(kind="hist")
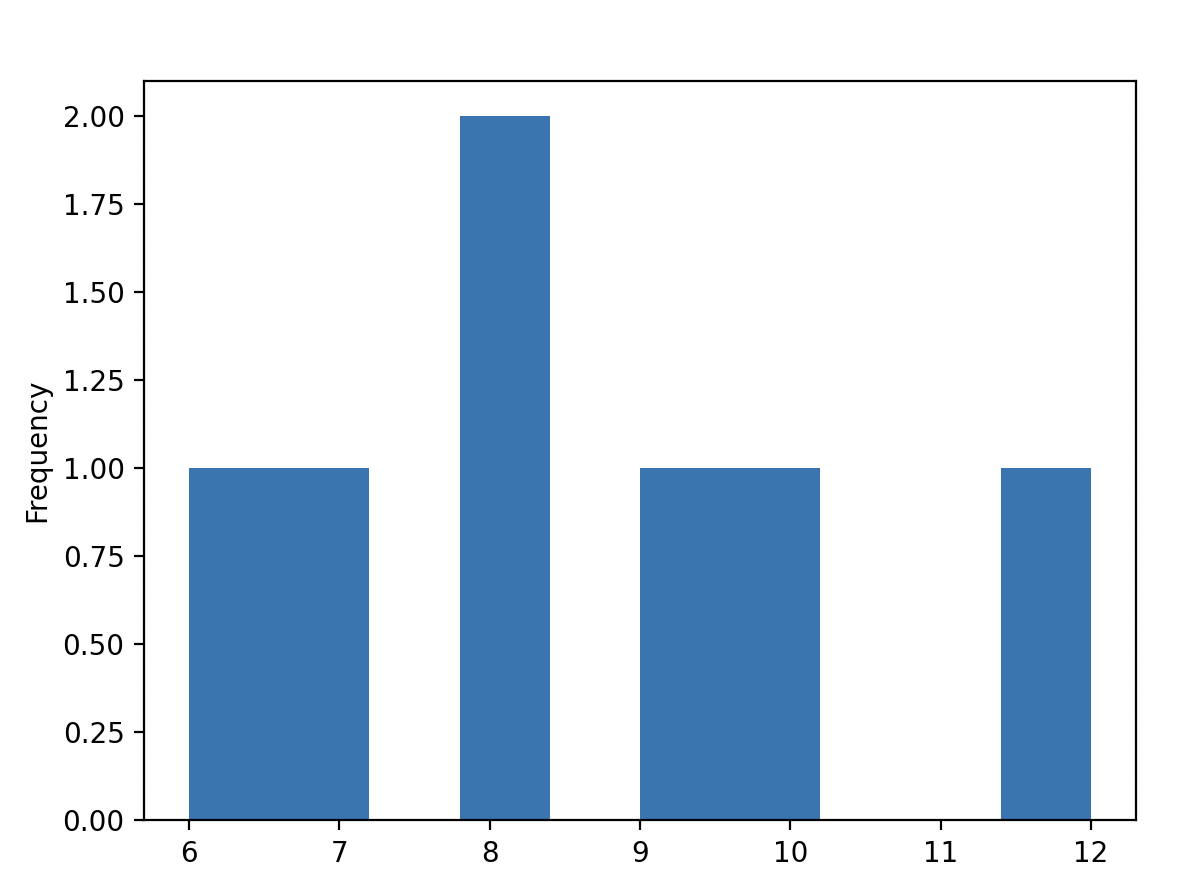
You can show only one histogram per column.
How to Select Specific Columns and Rows in Pandas (loc, iloc)
import pandas as pd
food_order = pd.DataFrame([
[1, "pizza", 12, 10],
[2, "pasta", 13, 8],
[3, "lunch box", 12, 12],
[4, "salad", 14, 8,],
[5, "soup", 13, 6],
[6, "burger", 15, 9],
[7, "dessert", 16, 7]
], columns= ["id", "Food", "Time", "Price"])
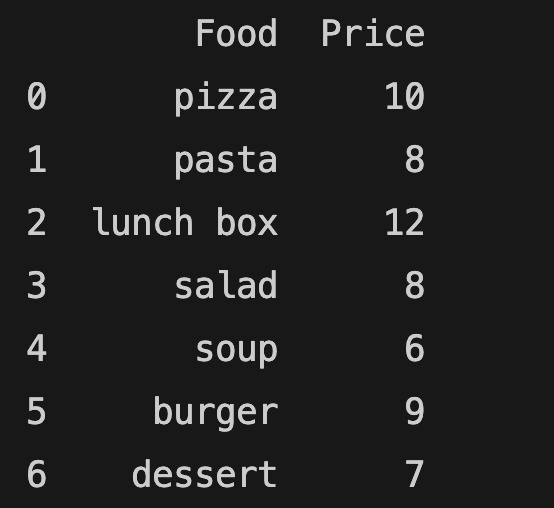
There are different ways to get a specific column or columns:
food_and_price = food_order[["Food", "Price"]]
print(food_and_price)
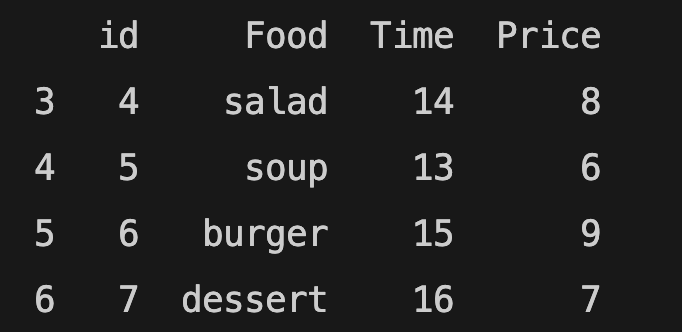
You can also get a specific row or rows:
selected_rows = food_order.iloc[3:7]
print(selected_rows)
You can also select rows with logic statements:
late_and_expensive_orders = food_order[(food_order.Price > 8) & (food_order.Time > 14)]
print(late_and_expensive_orders)
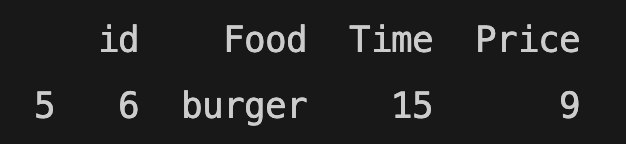
According to the statement above, the price of the orders should be higher than $7, and the time should be after 14.
How to modify DataFrames in Pandas
How to rename columns
You can use the rename() function and change the name of the specified column:
food_order.rename(columns={"Time": "pm"}, inplace=True)
print(food_order)
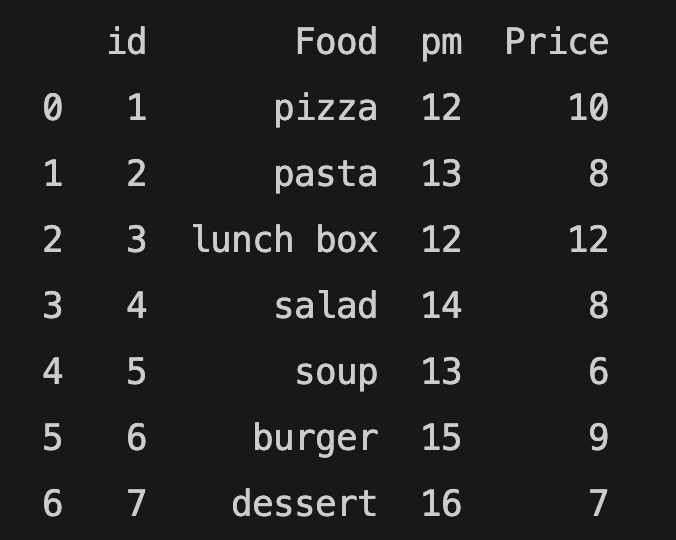
pm is the new name of the Time column.
How to reshape a Pandas DataFrame
import pandas as pd
school_grades = pd.DataFrame([
["Maria", "Biology", 70],
["Jack", "Math", 80],
["Dennis", "Chemistry", 72],
["Melissa", "Math", 80],
["Paul", "Biology", 60],
["Jack", "Biology", 90],
["Maria", "Math", 70]
], columns= ["Name", "Course", "Grade"])
You can use the pivot() function to change the DataFrame:
final_grades = school_grades.pivot(columns="Course", index="Name", values="Grade")
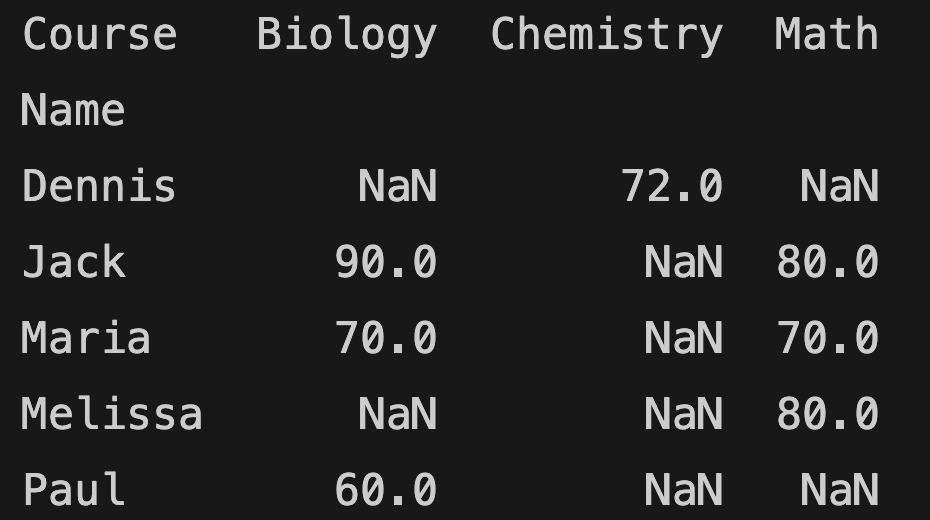
You need to specify column, row (in index) and values for pivot function.
How to Use Aggregate Functions in Pandas
Adding a column in Pandas
import pandas as pd
food_order = pd.DataFrame([
[1, "pizza", 12, 10],
[2, "pasta", 13, 8],
[3, "lunch box", 12.30, 12],
[4, "salad", 14, 8,],
[5, "soup", 13, 6],
[6, "burger", 15, 9],
[7, "dessert", 16, 7]
], columns= ["id", "Food", "Time", "Price"])
food_order DataFrame will be used for the examples below.
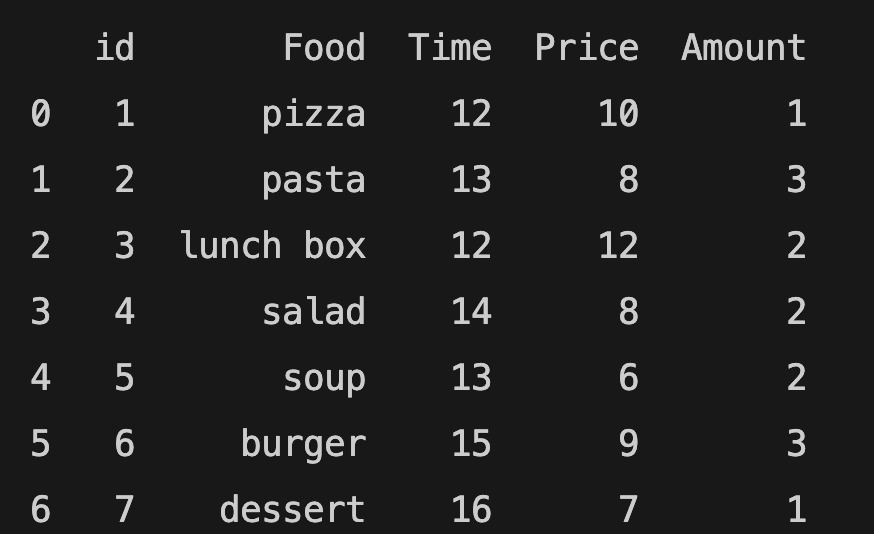
Adding a column to an existing DataFrame:
You can adda column to an existing Pandas DataFrame.
food_order["Amount"] = [1, 3, 2, 2, 2, 3, 1]
print(food_order)
Lambda Functions in Pandas
You can use lambda functions to add a new column:
food_order["Order"] = food_order.apply(lambda row: "Budget" if row["Price"] < 10 else "Expensive", axis=1)
print(food_order)
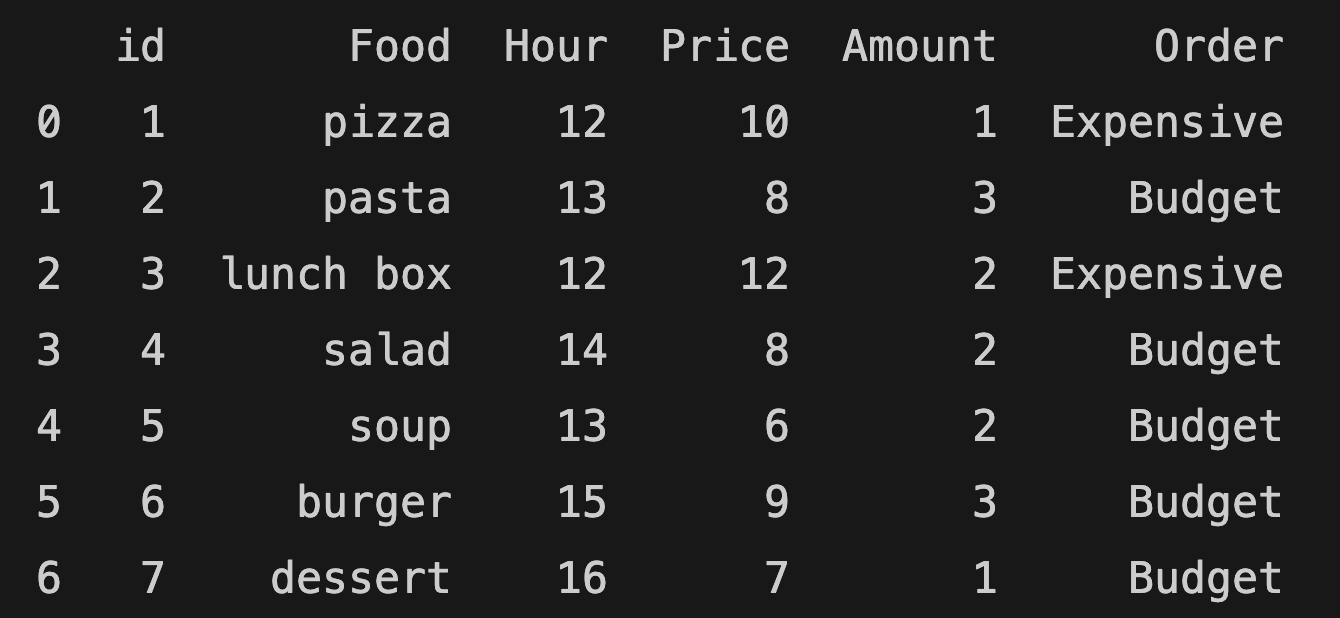
The function above adds a new column called "Order". The "Order" column shows whether the price is expensive or budget.
.groupby() method
Let's change the DataFrame and test the groupby method:
import pandas as pd
food_order = pd.DataFrame([
[1, "pizza", 12, 10],
[2, "pasta", 13, 8],
[3, "lunch box", 12, 12],
[4, "pizza", 14, 8],
[5, "pasta", 13, 6],
[6, "lunch box", 15, 9],
[7, "dessert", 16, 7]
], columns= ["id", "Food", "Time", "Price"])
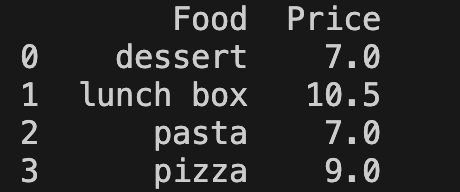
new_table = food_order.groupby(["Food"])["Price"].mean().reset_index()
print(new_table)
The groupby method in the example above displays two columns (Food and Price). The price column shows the average price of the food with the mean() method. You can find the result below:
.agg() method
You can alternatively use the .agg() method to apply one or more aggregation functions to your grouped data. This allows you to calculate different statistics for each column in a single step, making your data summaries more concise and powerful.
grouped = food_order.groupby('Food').agg({
'Price': ['sum', 'mean']
})
print(grouped)
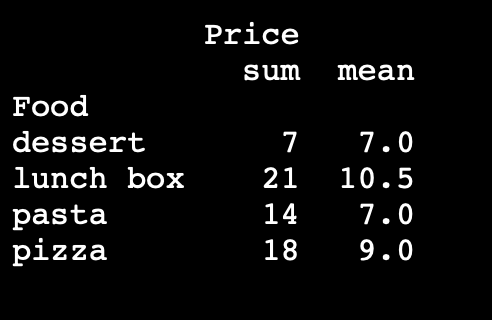
In the example above, the agg() method calculates the total and average prices for each food category.
How to merge tables in Pandas
There are different ways to merge DataFrames in Pandas. You need to use the merge() function:
new_table = pd.merge(table_one, table_two)
The syntax above may not work for every table.
import pandas as pd
school_grades1 = pd.DataFrame([
["Jenny", "Biology", 70],
["Dennis", "Math", 80],
["Jack", "Chemistry", 72],
], columns= ["Name", "Course", "Grade"])
school_grades2 = pd.DataFrame([
["Dennis", "Biology", 80],
["Jenny", "Math", 40],
["Jack", "Geography", 32],
["Maria", "Chemistry", 42]
], columns= ["Name", "Course", "Grade"])
Left, right, inner, outer merge in Pandas
You can also merge on a specific column. Let's merge the two DataFrames above:
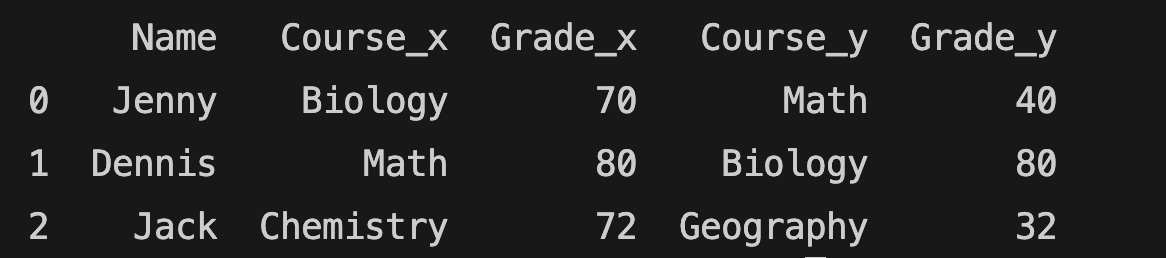
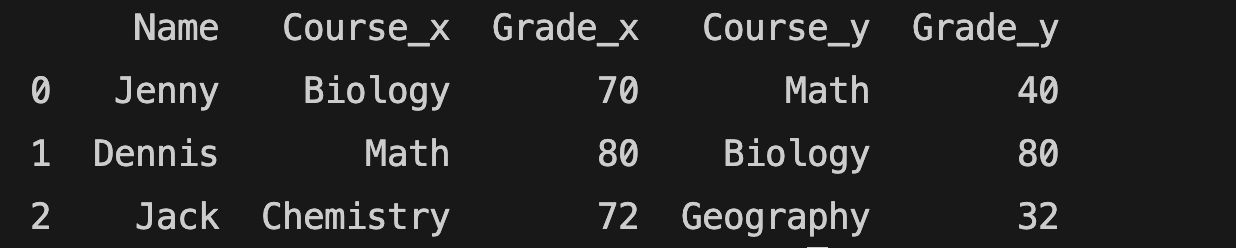
all_grades = pd.merge(school_grades1, school_grades2, how="left", on="Name")
The left merge function above includes all rows from the first (school_grades1) table but only rows from the second (school_grades2) table that match the first table.
You can find the result below:
You can use the same syntax for right, outer, and inner merges.
The right merge is just like the left merge.
Inner merge only includes matching rows.
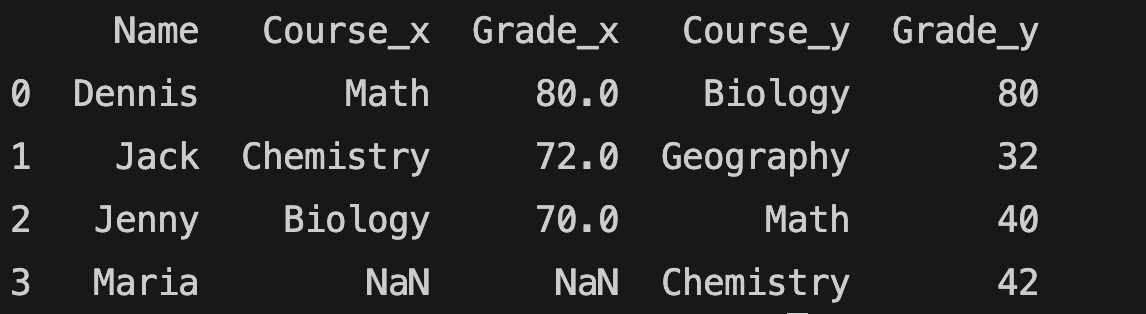
An outer merge includes all rows from both tables, even if they don't match. Let's try outer merge and inner merge:
all = pd.merge(school_grades1, school_grades2, how="outer", on="Name")
print(all)
all = pd.merge(school_grades1, school_grades2, how="inner", on="Name")
print(all)
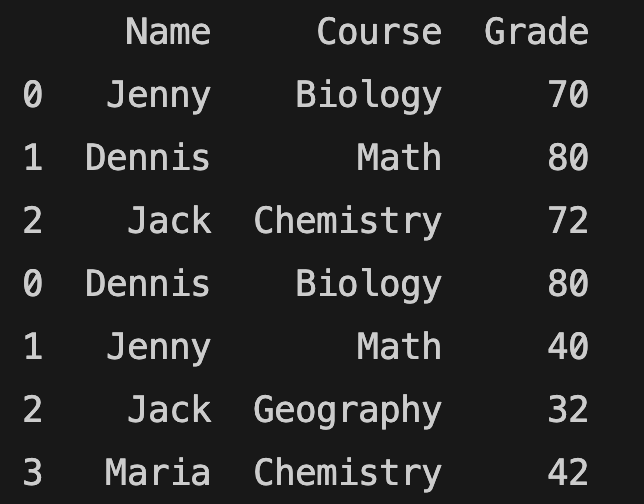
Concat function
If all the columns are the same, you can also use the concat() function:
pd.concat([school_grades1, school_grades2])